Visualization
In this section, we aim to provide functionalities to have visual representation of embeddings.
In this first version, we provide a wrapper class for the sklearn.manifold.TSNE, reducing, by default, the dimensionality of embeddings to two dimensions.
To use this model, we assume we already have some embedding vectors and some labels for each of them. For this example, let’s create random vectors:
from numpy import array, random

embeddings = random.rand(100, 100)
names = [f"name_{i}" for i in range(100)]
classes = [1,2,3]
labels = [random.choice(classes) for _ in range(100)]

name_to_embedding = dict(zip(names, embeddings))
name_to_label = dict(zip(names, labels))
Note
Notice that the previous code is generating synthetic data. In real application of mOWL, the embeddings would come from a trained model and the labels can come from either the ontology or any other external source. Furthermore, the names would be ontology entities (classes, individuals, …).
import mowl
mowl.init_jvm("10g")
from mowl.visualization import TSNE
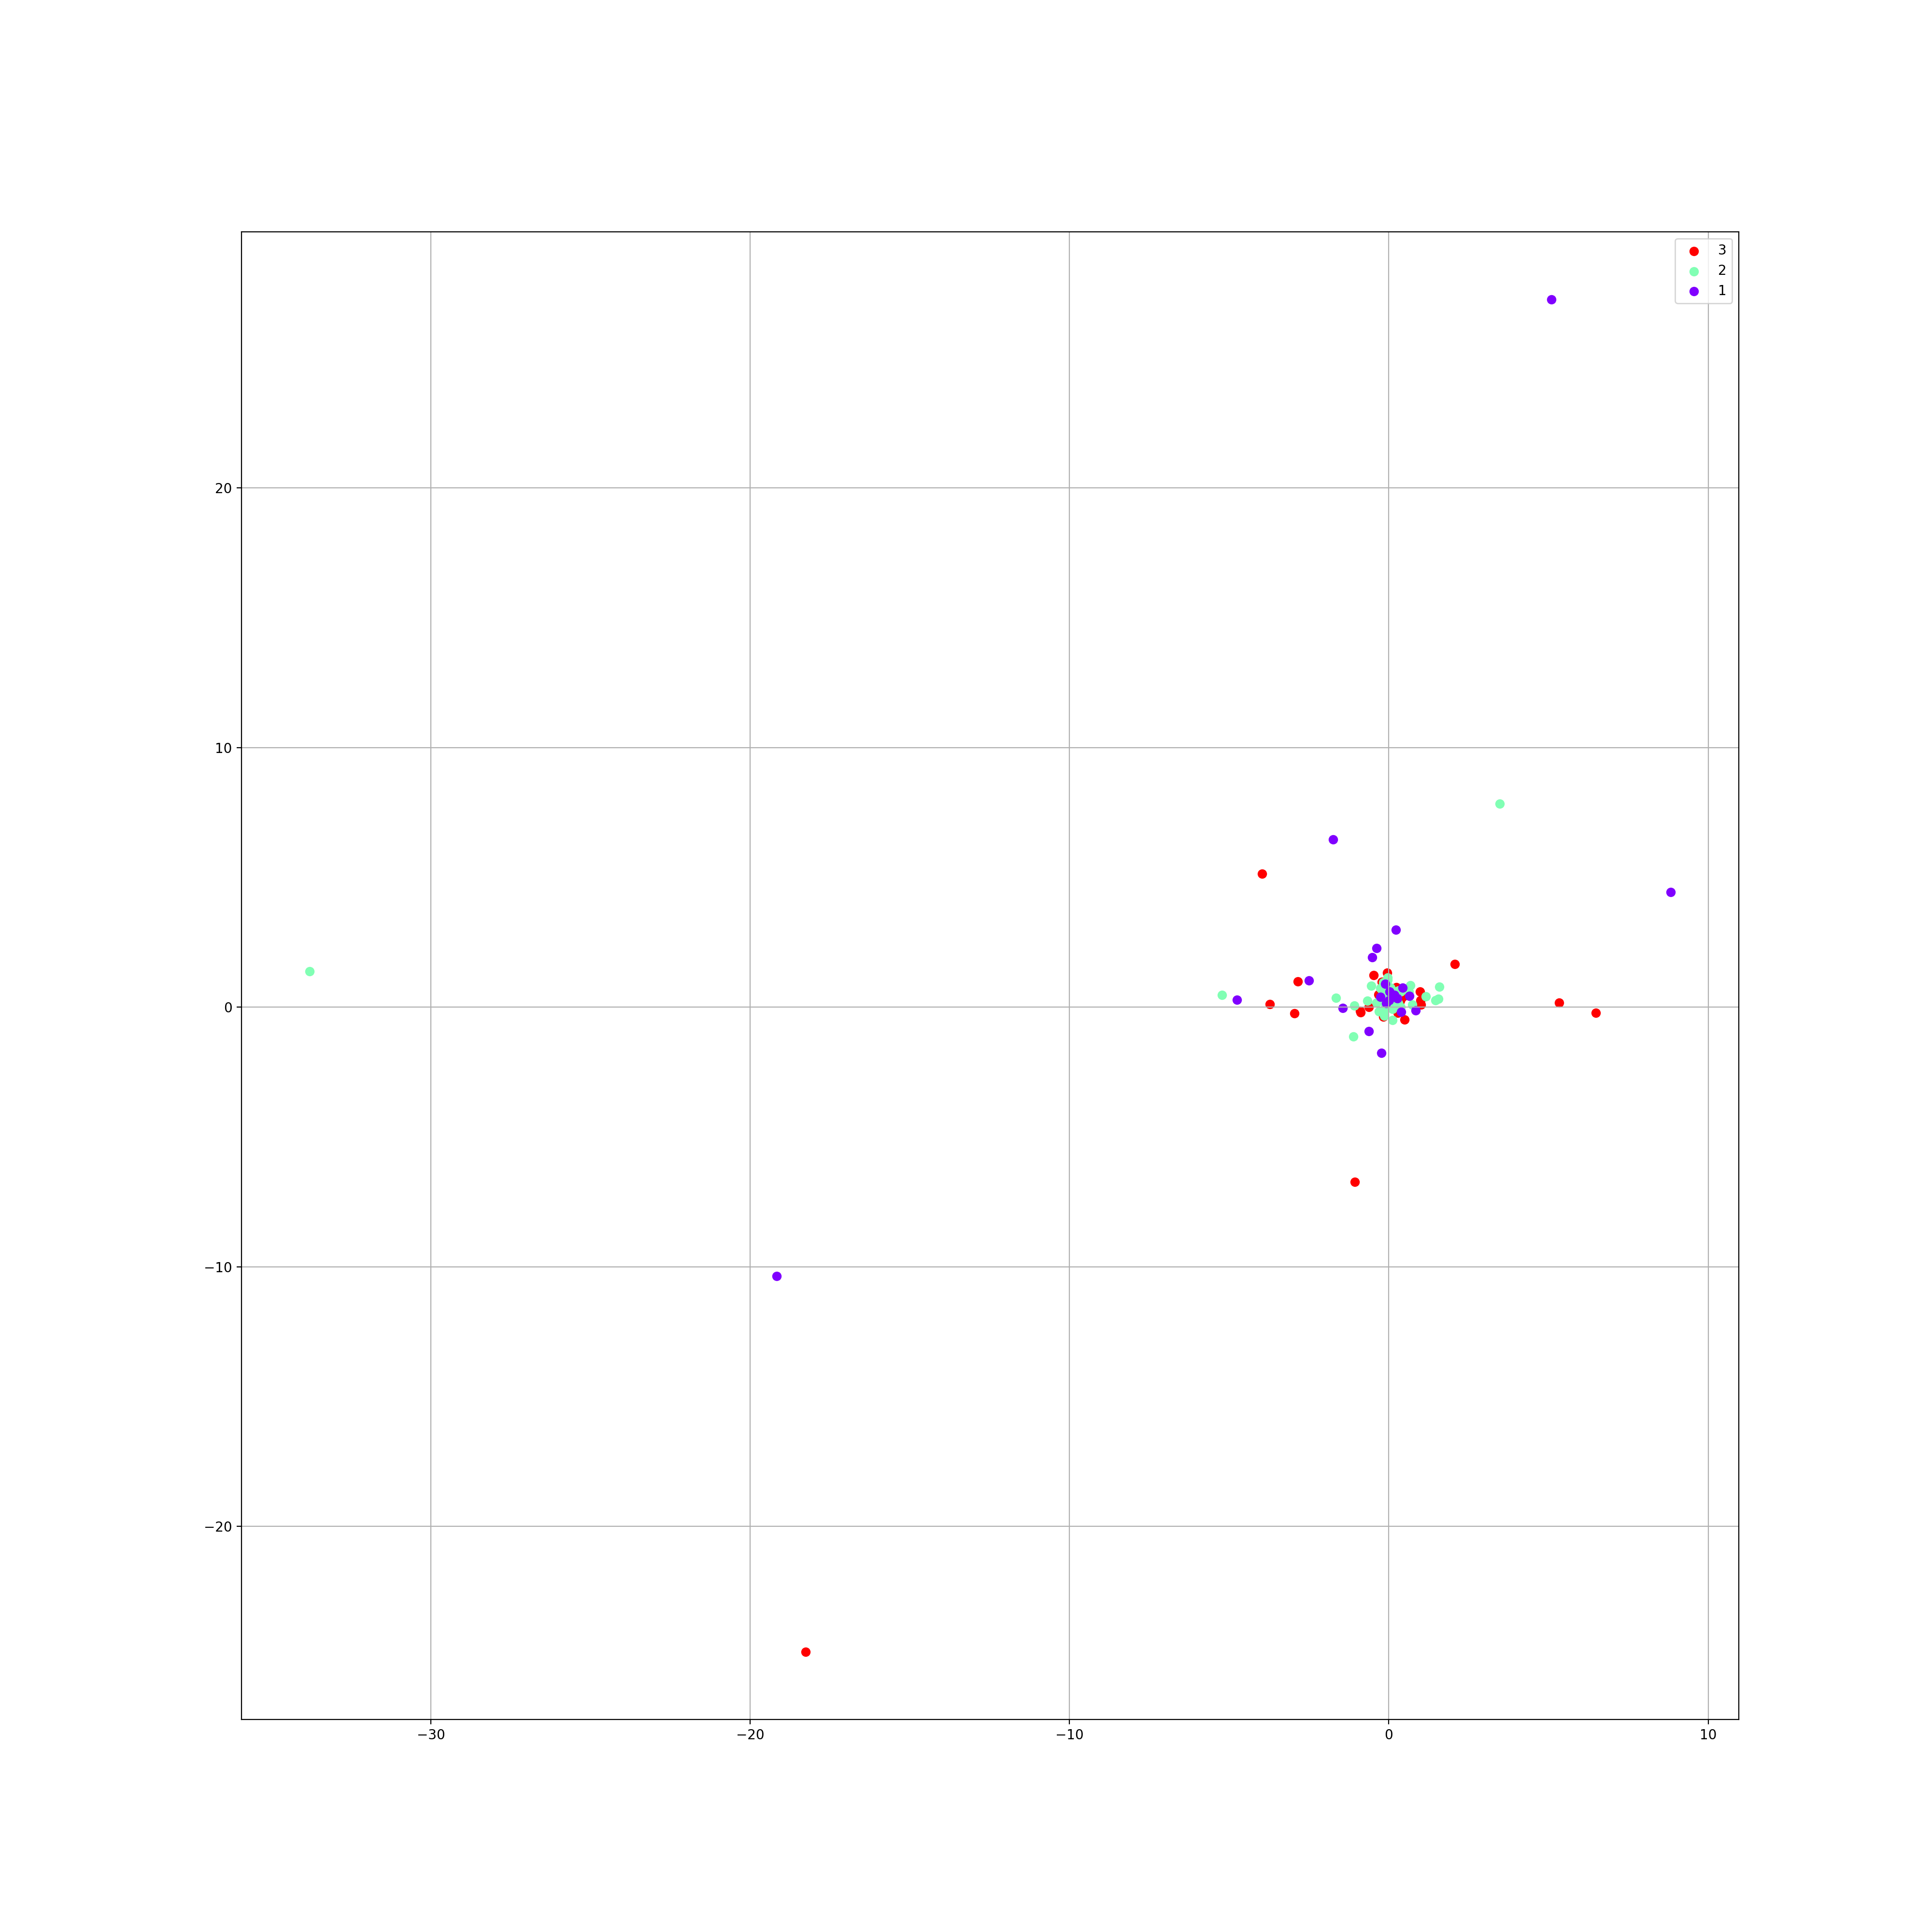
tsne = TSNE(name_to_embedding, name_to_label)
tsne.generate_points(250, workers=4)
tsne.show()
(Source code, png, hires.png, pdf)
